2022 Security Benchmark Index
Benchmarking allows security leaders to evaluate, check or compare how their position or function matches others in the industry. How many security employees do similar-sized companies in similar market sectors have within their organization? Did your peers see an increase in their security budget year-over-year? If so, by how much? Are security executives within your market sector responsible for many of the same programs you are responsible for?
Security leaders across all market sectors fill out The Security Benchmark Report — an in-depth survey which collects data on programs, initiatives, security budgets, responsibilities, technology deployments, security-related training, employees and more — to gain real-world insight into what other security programs are doing.
The Security Benchmark Report is an editorial initiative that collects and reports on self-reported data only. Our editorial goal is to provide security leaders with a free benchmarking program that can help them continue to evolve and grow their security program year after year.
While The Security Benchmark Report aims to offer security programs insights into what their peers are doing, we understand that the metrics important to one program may be completely different than another program.
Therefore, the biggest benefit to filling out The Security Benchmark Report survey is that each security executive respondent receives the raw, anonymized data from the survey to compare and contrast across the industry or specifically companies within their sector based on any metric they wish.
For further data and comparisons beyond what is reported on these pages, fill out The Security Benchmark Report survey next year. Security magazine does not sell or share respondent contact information collected from this survey.
The survey is filled out by security practitioners that have responsibility, at least in part, for physical security within their organization. In this year’s survey, we asked respondents about overall enterprise revenue or operating budget, security budgets, number of guarding personnel, security technologies, roles, responsibilities, reporting structure and much more. We include averages on security budget as a percent of revenue and average money spent on security-related training.
Security Roles & Responsibilities

The Security Benchmark Report respondents were asked about their top issues / concerns in 2022 and 2023 in regards to risk mitigation and enterprise security. The top 10 answers appear here in order. Honorable mentions include Theft, Security budget, and Natural disasters. SOURCE: The Security Benchmark Report, November 2022

The Security Benchmark Report respondents were asked where their security function reports to or resides within. The majority of security teams responding to this year’s Security Benchmark Report report to or reside within COO / Operations, followed closely by CRO / Risk / Legal / General Counsel. SOURCE: The Security Benchmark Report, November 2022

The Security Benchmark Report respondents were asked to choose the title of their senior-most security executive within their enterprise. The choices, which are not exhaustive, are meant to generally group titles for comparison and include: C-Level Executive, Director, Senior Director, Senior Manager, Vice President, General Manager or Not Applicable (N/A). Among those choosing N/A were Police Chiefs, Managers and Supervisors. SOURCE: The Security Benchmark Report, November 2022

The Security Benchmark Report respondents were asked to report which geographic areas their security organization provides risk and security services to within their enterprise. Respondents were able to choose as many geographic areas as applicable. SOURCE: The Security Benchmark Report, November 2022

The Security Benchmark Report respondents were asked if their security organization is Centralized, Decentralized or Regional. The majority of respondents reported their security organization as being Centralized. For this survey’s purpose, the distinction between Decentralized and Regional security is that some Regional security programs may behave in a centralized manner for their determined region, while Decentralized generally means there may be security organizations in multiple locations within an enterprise functioning independently from one another. Those respondents choosing Other reported working in single sites or a Partially Centralized and Partially Decentralized structure. SOURCE: The Security Benchmark Report, November 2022

The Security Benchmark Report respondents were given a list of 37 roles and responsibilities that may fall under the security function at an organization and were asked for the level of responsibility the team has over that role within their enterprise. Here are the 15 most common job responsibilities (in alphabetical order) that the security function Owns / Leads or Manages, according to respondents. For this survey, Owning / Leading the responsibility means security both manages and funds the program, while Managing means security manages the program, but another group funds it. SOURCE: The Security Benchmark Report, November 2022

The Security Benchmark Report respondents were asked to report on the security team’s roles and responsibilities within their organization. This year, we asked security leaders for the level of responsibility for each function within their organization with the following choices: Own / Lead Function: Security manages and funds the program; Manage: Security manages the program but another group funds it; Support: Security sets policy, consults on the program (or represents physical security perspective) but does not manage or fund the program; Not Involved: Company has the program but security is not involved in it; Do Not Have; Do Not Know. We have combined Not Involved / Do Not Have or Do Not Know responses for the purposes of this chart, however, 17 more responsibilities and breakdown of responses, in addition to those reported here, are included in the survey and are a part of the full report that respondents receive. One interesting note is that comparing COVID-19 responsibilities with 2021’s responses reveals a smaller number of respondents this year reporting Owning / Leading and Managing COVID-19 response, while a slightly higher percent report Supporting the efforts. One possible explanation could be that, now a few years into the pandemic, organizations have hired or diversified response efforts to in order to sustain pandemic efforts in the long term. SOURCE: The Security Benchmark Report, November 2022


SOURCE: The Security Benchmark Report, November 2022

The Security Benchmark Report respondents were asked what security checks/testing the organization conducts as part of preemployment screening. Respondents were allowed to indicate as many answers as applicable to their organization. Respondents were also able to choose Other (10%) or Don’t know (3%). The Don’t know answer is meant to give other security organizations knowledge into the roles / responsibilities / maturity of other security programs. For this question, other forms of screening indicated by respondents included education verification, media checks and DMV checks. SOURCE: The Security Benchmark Report, November 2022


The Security Benchmark Report respondents are responsible, at least in part, for physical security within their organization. We asked survey respondents for more insight into the ever-evolving and changing roles of security, including whether their role within the organization is ultimately responsible for both physical security and health & safety, as well as physical security and cybersecurity. In 2021, only 14% of The Security Benchmark Report respondents reported being responsible for both physical security and cybersecurity, translating to a 57% increase in this year’s report. In 2021, 51% of respondents reported being responsible for both physical security and health & safety, translating to a 10% increase in this year’s report. SOURCE: The Security Benchmark Report, November 2022
Security Budgets, Spending & More

The Security Benchmark Report captures information on security budgets and total reported revenue / operating budget in the overall organization. To calculate the security budget as a percentage of revenue across the enterprise, the security budget is divided by the total revenue. Companies that reported information on both security budget and total revenue are included in this number; however, if any numbers appeared inaccurately reported or incorrect, they were removed from the calculation. SOURCE: The Security Benchmark Report, November 2022

Here is the average security budget as a percent of revenue by market sector. To calculate the security budget as a percent of revenue across the enterprise, the security budget is divided by the total revenue. Companies that reported information on both security budget and total revenue are included in this number; however, if any numbers appeared inaccurately reported or incorrect, they were removed from the calculation. SOURCE: The Security Benchmark Report, November 2022

A majority of The Security Benchmark Report respondents reported an increased security budget compared with the previous year’s budget. In 2021, 66% of respondents reported an increased budget that year, while this year 69% of respondents reported an increased security budget year-over-year. SOURCE: The Security Benchmark Report, November 2022

If The Security Benchmark Report respondents indicated an increased security budget in 2022 compared with 2021, they were asked what percentage that budget increased. The average increase reported by those respondents for 2022 was 19%. If respondents indicated their security budget in 2022 decreased compared with 2021, they were asked for the percentage decrease. The average decrease reported by those respondents for 2022 was 11%. In 2021, the average increase in security budget was 14% and the average decrease in security budget was 21%. SOURCE: The Security Benchmark Report, November 2022
Security Guarding & Operations

Of those The Security Benchmark Report respondents that reported using guard / officer forces at their organization, 34% of security leaders reported using both proprietary and contract officer / guard forces, while 33% reported having only proprietary guards and 33% reported having only third-party / contract guards. SOURCE: The Security Benchmark Report, November 2022
.svg)

Overall, 68% of The Security Benchmark Report respondents reported having a security operations center (SOC) or global security operations center (GSOC) within their enterprise. Respondents that answered “Yes” to having a SOC were asked if their SOCs provide security and risk services to the entire enterprise or just a particular region or site. Overall, among all sectors, 88% of respondents that reported having a SOC offer those services to the entire enterprise. SOURCE: The Security Benchmark Report, November 2022

Among the 68% of The Security Benchmark Report respondents that reported having a global security operations center (GSOC) or security operations center (SOC), Security magazine asked respondents which services their SOCs provide to the enterprise, represented in the bar graph here. Respondents were able to choose as many responses as applicable. SOURCE: The Security Benchmark Report, November 2022
Security-Related Training & Technology
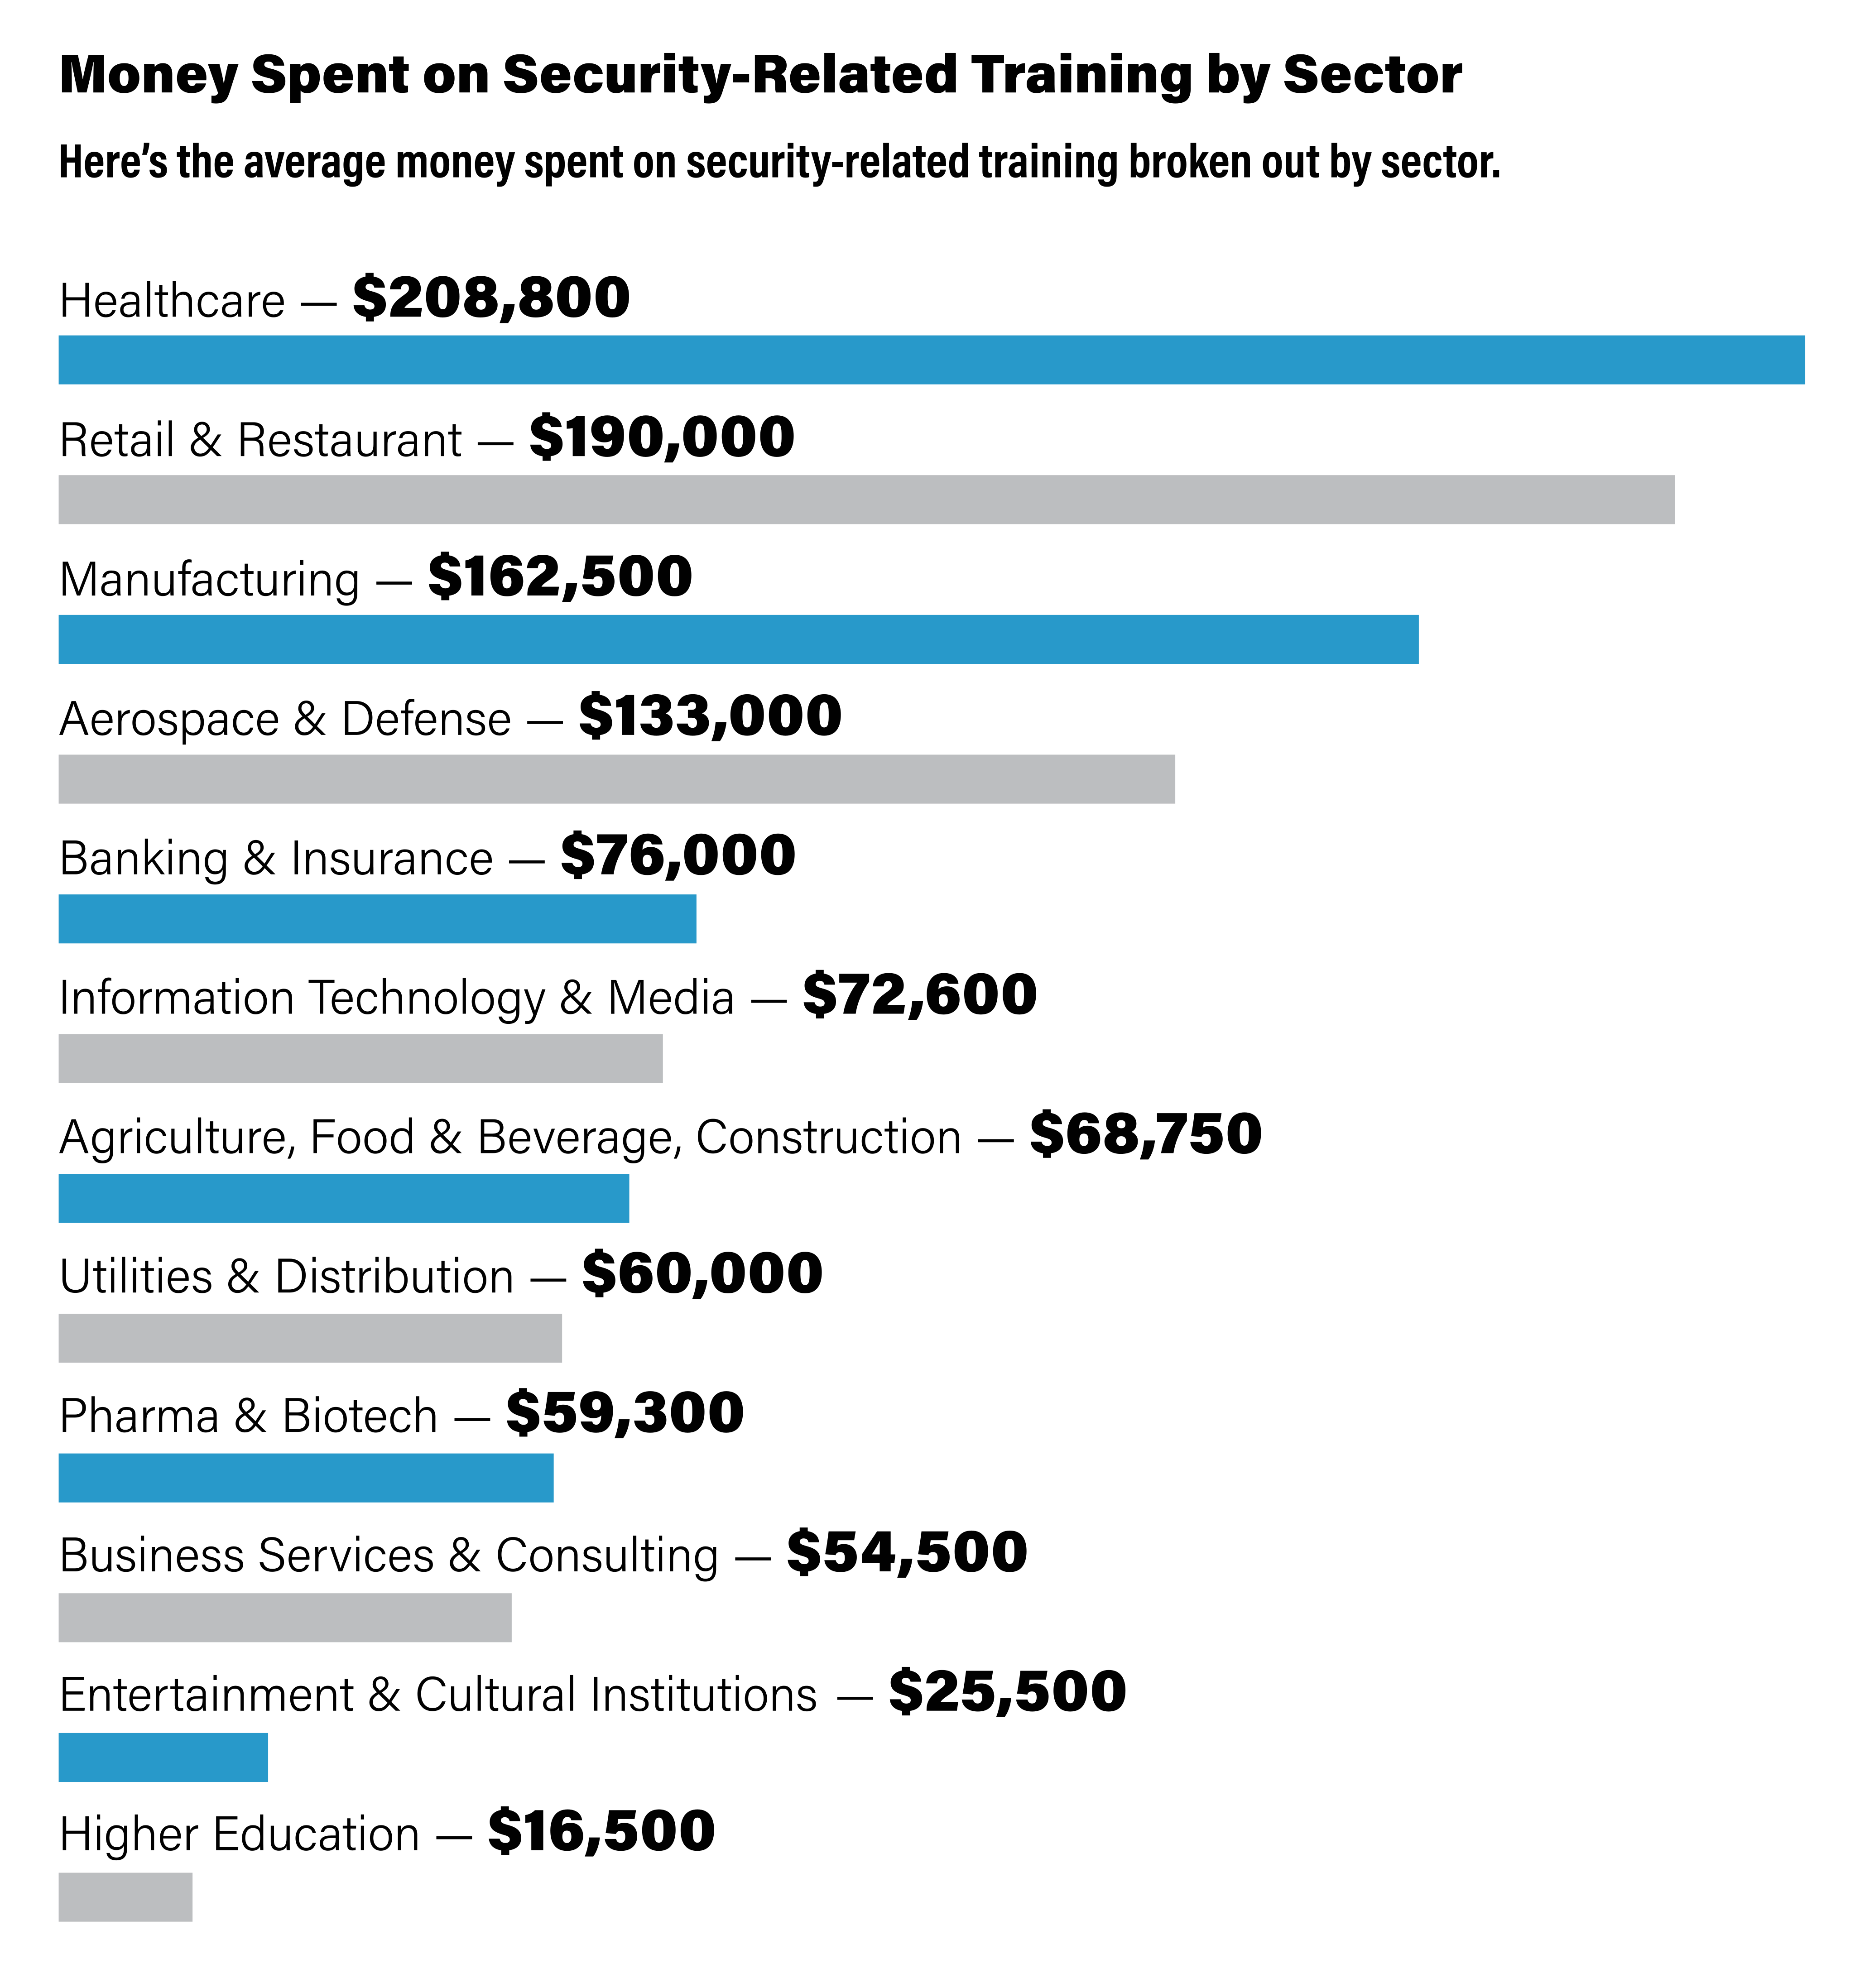
Here is the average money spent on security-related training by sector, based on self-reported information from The Security Benchmark Report respondents. Outliers or information that appeared to be inaccurately reported were excluded from these calculations SOURCE: The Security Benchmark Report, November 2022
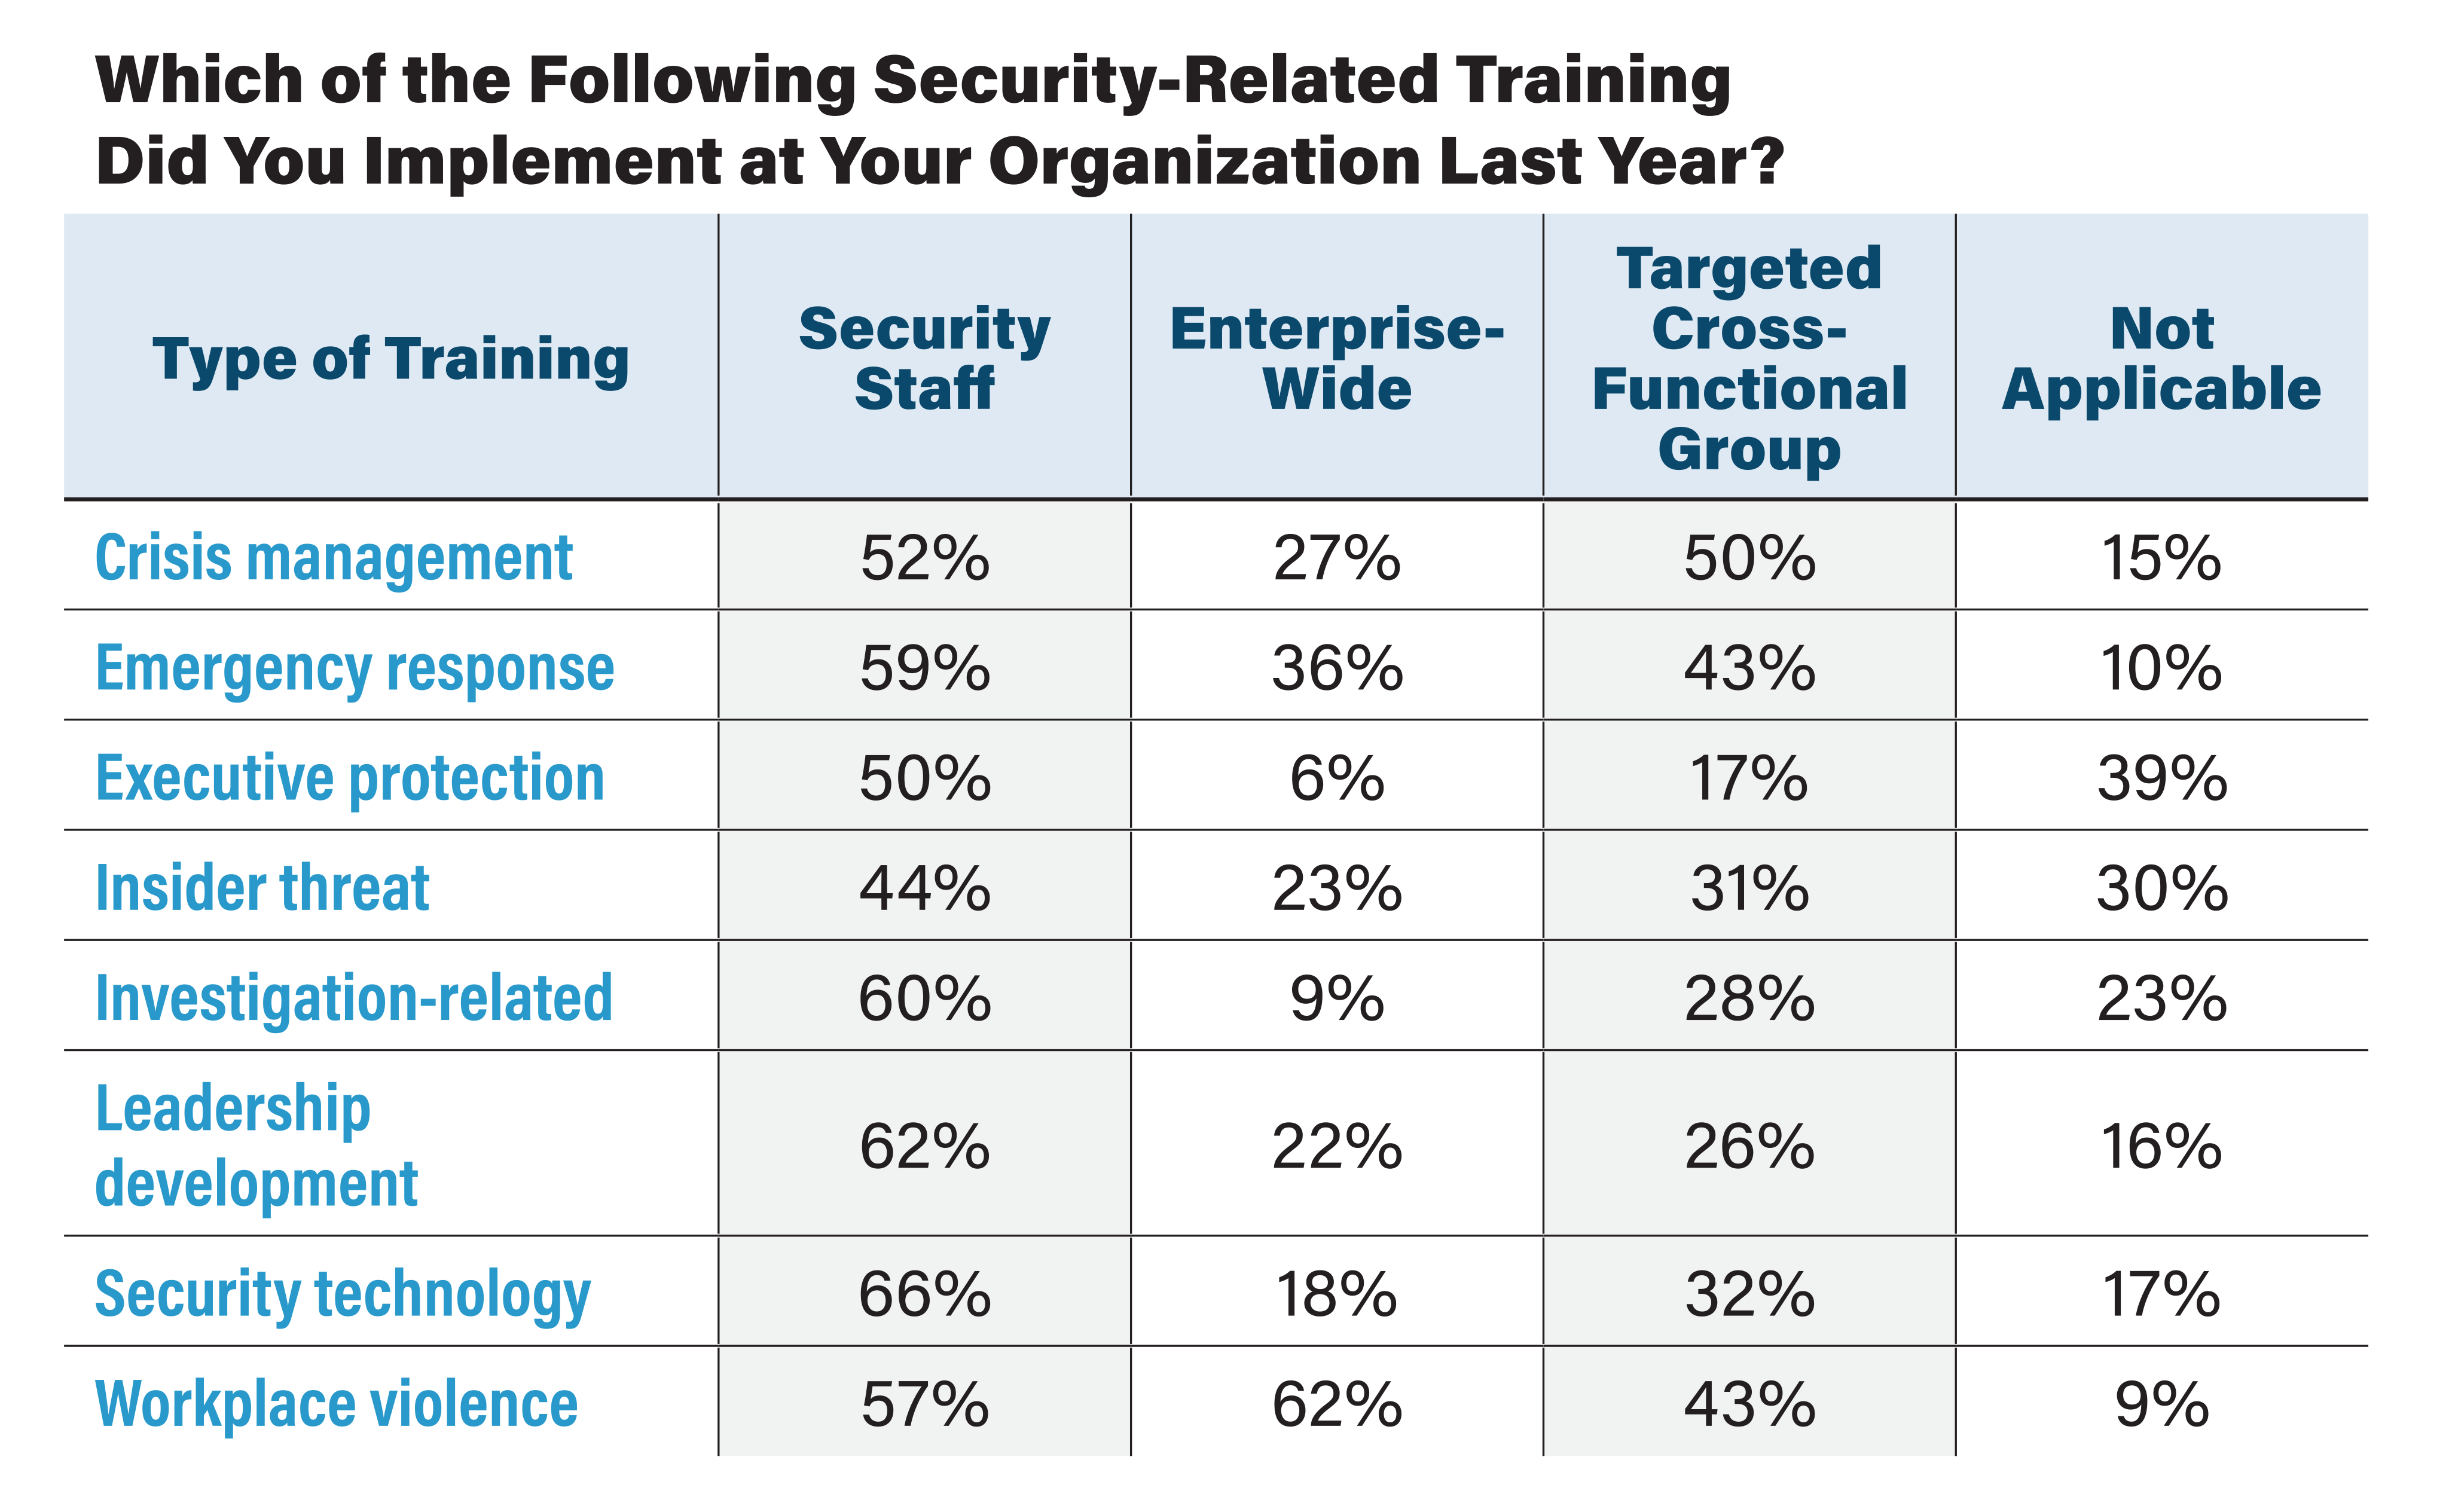
The Security Benchmark Report respondents were asked to report the security-related training they held within their enterprise in 2021. Respondents were able to choose multiple populations for each training if applicable. For example, with Workplace violence, some organizations implemented training for both security staff as well as targeted cross-functional groups. Respondents were allowed to report using as many training types as applicable. “Not Applicable” refers to those organizations that did not implement that type of training in 2021. In addition to these responses, respondents were able to choose “Other.” Some of those responses included: Active shooter; De-escalation; Crime prevention; AED/CPR training; Behavioral threat assessment; Diversity, equity and inclusion (DEI); Drug diversion awareness; COVID-19 protocols; Zero harm initiative for EHS; Suspicious indicators; Suspicious packages; Taser and firearm; Female travelers; Travel security; and Mental health. SOURCE: The Security Benchmark Report, November 2022
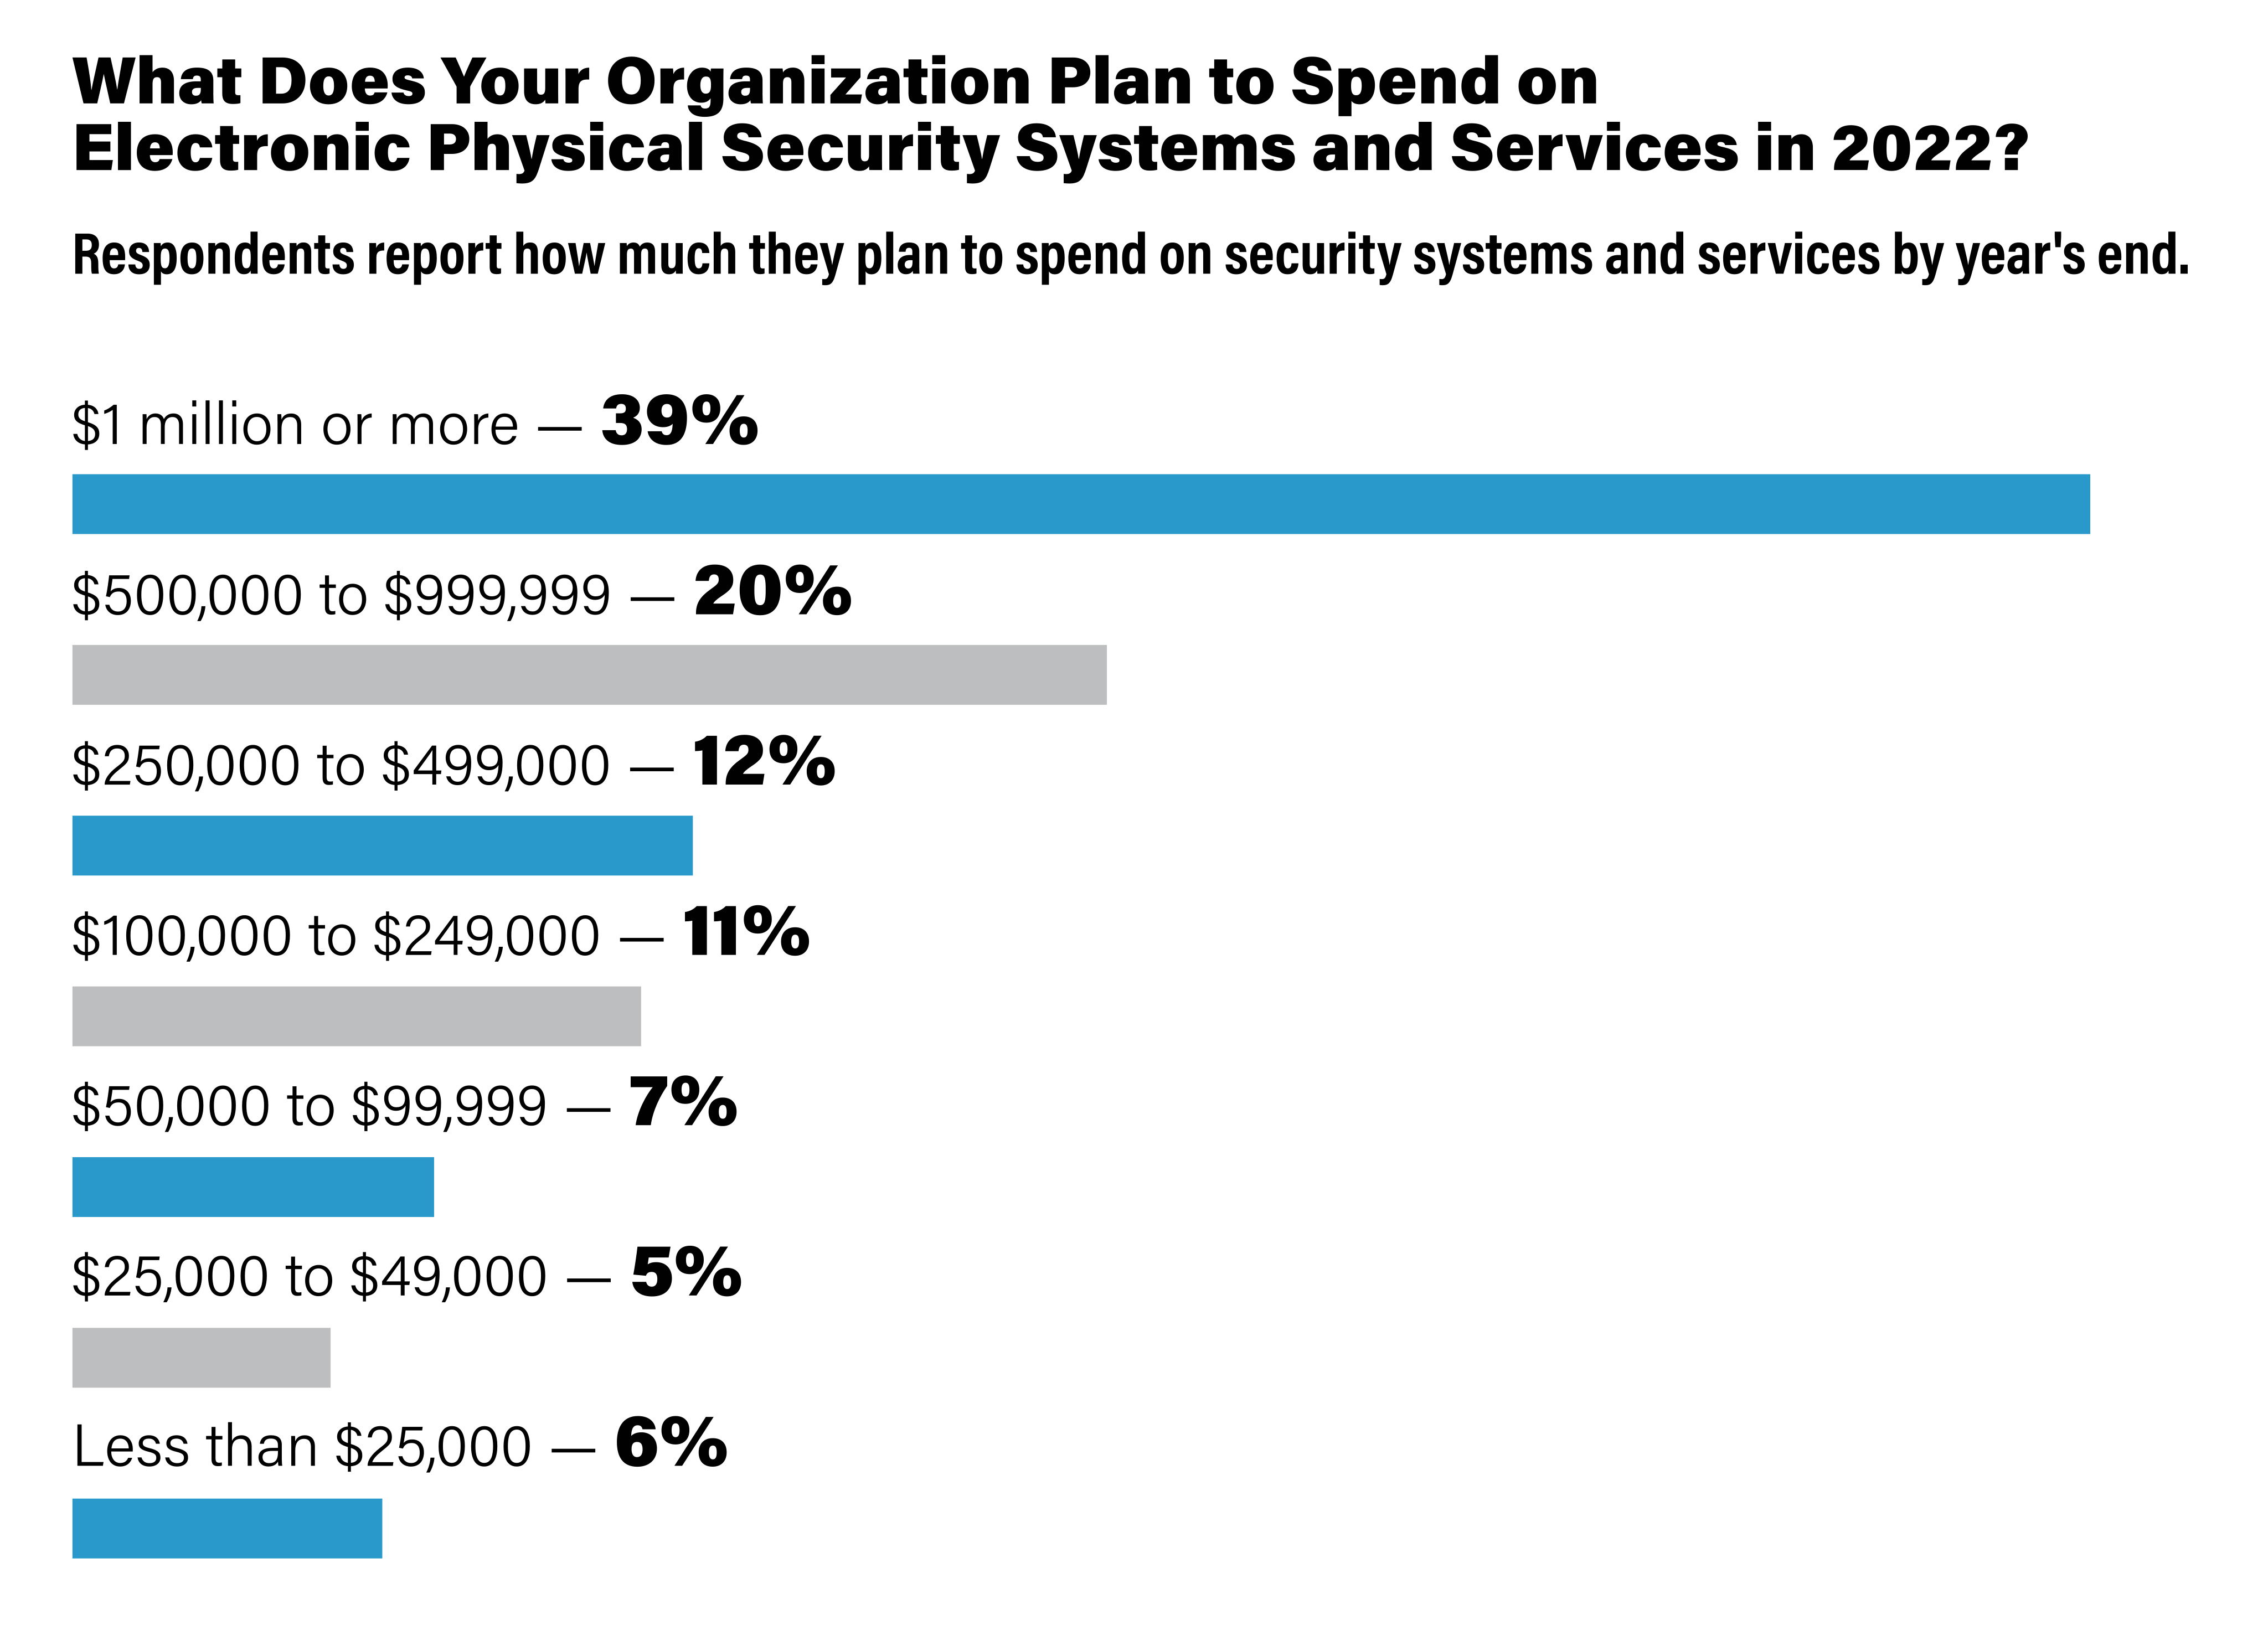
The Security Benchmark Report respondents were asked how much their organization plans to spend on electronic physical security systems and services this year. Respondents were asked to choose the range that best describes their planned spending. SOURCE: The Security Benchmark Report, November 2022
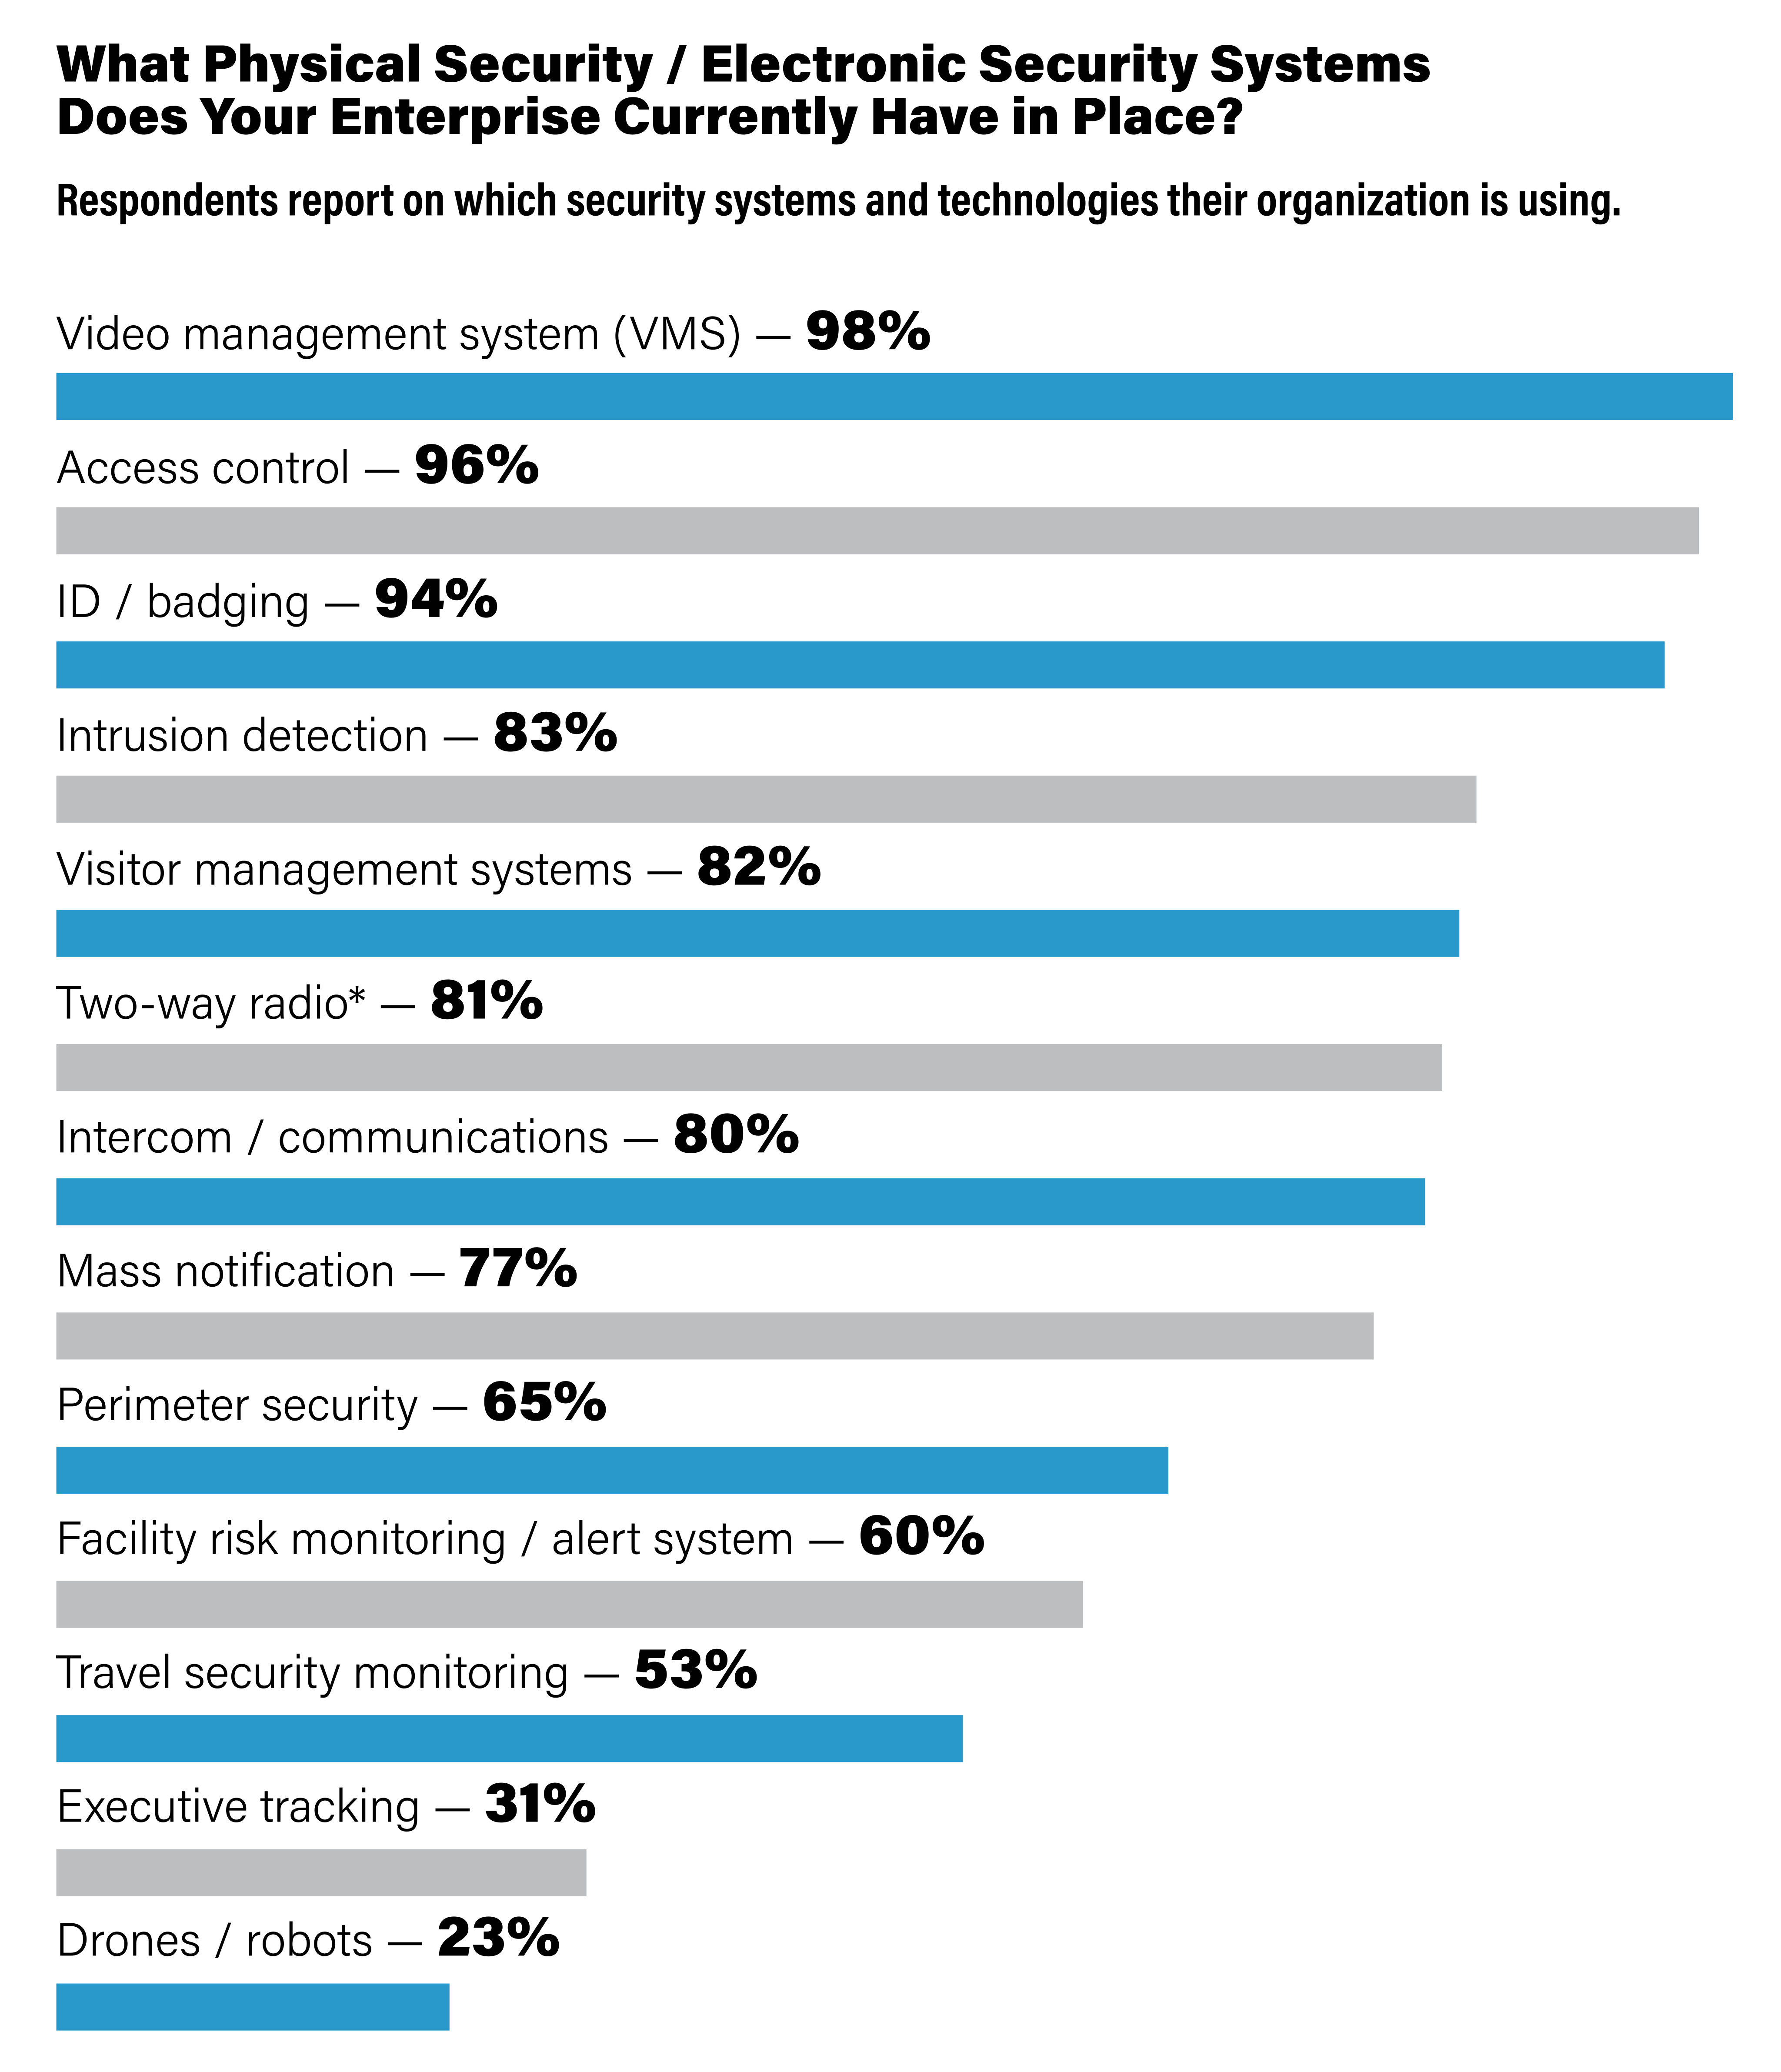
The Security Benchmark Report respondents were asked which physical and / or electronic security systems and equipment their enterprise currently has in place. Respondents were able to choose as many systems as applicable. Respondents were also allowed to say which “Other” security technologies they have implemented in their enterprises, and some of those include: weather notification; mobile phone incident reporting application; thermal cameras; physical access control systems; K-9 detection; license plate recognition; shooter detection; or duress. *Two-way radio systems are included here if reported for security personnel only. SOURCE: The Security Benchmark Report, November 2022
Security Teams Using Metrics
Security Teams Emphasizing Metrics to Define Productivity
These security programs report maintaining a metrics program that clearly defines productivity, value creation and cost avoidance.
The below list (in alphabetical order) are those security leaders that reported maintaining a security metrics program that defines productivity, value creation and cost avoidance. Respondents are allowed to remain anonymous from any listings or rankings within the published The Security Benchmark Report; therefore, any respondents choosing to remain anonymous are not included in this list. SOURCE: The Security Benchmark Report, November 2022
|
COMPANY |
SECURITY BENCHMARK LEADER |
|
Abbott |
Geoff Shank, Divisional Vice President |
|
AB InBev |
Tom Yarbrough, Head of Global Security |
|
Actionet |
Shelly Nuessle, Information Systems Security Manager |
|
Adtalem Global Education |
Robert Soderberg, Vice President, Chief Safety, Security & Resiliency Officer |
|
AdventHealth Central Florida Division |
Christopher C. Fender, Executive Director of Safety, Security & Emergency Management |
|
American Electric Power |
Steve Swick, Chief Security & Privacy Officer |
|
American Family Insurance |
Vice President, Protective Services |
|
American Systems Corporation |
Dr. Matthew D. Hollandsworth, CISSP, CPP, Director, Corporate Security, Facilities & Safety |
|
Arthrex |
Kevin Cliff, Director, Global Corporate Security |
|
Associated Grocers of New England Inc. |
Alan R. Cote, Director of Risk Management |
|
AutoZone |
Jennie Anderson, Vice President, Loss Prevention & Safety |
|
AVANGRID |
Brian Harrell, Vice President & Chief Security Officer |
|
Baker Hughes |
Kevin Wetherington, Chief Health Safety Environment, Security & Quality Officer |
|
Ballad Health |
Ken Harr, Corporate Director / Chief Security Officer Safety, Security & Emergency Management |
|
Baycrest Centre for Geriatric Care |
Martin Green, Manager, Security, Telecommunications & Emergency Preparedness |
|
BeiGene |
Eric J. Van Balen, Head of Global Security |
|
Big Lots |
Robert LaCommare, CFI, Vice President Asset Protection, Safety, & eCommerce Fraud |
|
Biogen Inc. |
Daniel Biran, Vice President, Global Security |
|
Black Knight Inc. |
Michael A. Skoglund, SVP, Senior Director of Physical Security, Facilities, & IT Asset Management |
|
Black Knight Security |
Dennis W. Lejeck, President |
|
The Boeing Company |
Dave Komendat, Vice President & Chief Security Officer* |
|
Booz Allen Hamilton |
Richard M. Lake, Vice President, Security Services |
|
Boston Children’s Hospital |
Robert Ryan, Senior Director of Security |
|
Builders FirstSource |
Randy Johnson, Director of Loss Prevention |
|
Chubb |
Richard M. Kelly, Senior Vice President, Chief Security Officer |
|
CIP Corps |
Karl Perman, CEO |
|
The Claremont Colleges Services Campus Safety Department |
Stan Skipworth, Associate Vice President |
|
Clarios |
Robb Koops, Global Security Director |
|
Cleveland Clinic |
Gordon Snow, Chief Security Officer |
|
Corning Incorporated |
Steve Harrold, Vice President, Corporate Security |
|
Denver Health Medical Center |
Eric Smith, Director of Security Services |
|
Ellis Park Racing & Gaming |
Matthew Pressley, Security / Surveillance Manager |
|
Exact Sciences Corporation |
Scott A. Brinkman, Associate Director, Global Corporate Security |
|
Fidelity Investments - Global Security and Investigations |
Craig Magaw, Chief Security Officer |
|
Franciscan Health Olympia Fields |
Daniel Lempa, Director of Safety & Security |
|
Gap Inc. |
Chris Nelson, Senior Vice President, Asset Protection |
|
GE Healthcare |
Shiva Rajagopalan, Senior Director, Security Operations |
|
Geisinger |
Sean McGinley, Associate Vice President, Security Operations |
|
General Dynamics |
Jeffrey Mazanec, Chief Security Officer |
|
Global Atlantic Financial Group |
Robert Shickel, Senior Vice President, Chief Security & Resilience Officer |
|
GoDaddy |
Jason Veiock, Senior Director, Safety, Security & Resilience |
|
GuideWell |
George Frandsen, Senior Director |
|
Holcim |
Cedrick Moriggi, Chief Resilience Officer |
|
The Jackson Laboratory |
Brian O’Rourke, Senior Director, Global Security Services |
|
Jcshop |
Larry Payne, CEO |
|
Kellogg Company |
Scott Lindahl, Vice President, Chief Security Officer |
|
Kyndryl |
Chief Security Officer |
|
Massachusetts General Hospital |
Bonnie Michelman, Executive Director, Police, Security & Outside Services |
|
Materion Corporation |
Monica N. Mellas, CPP, Vice President |
|
McKesson Corporation |
David Aflalo, Senior Vice President & Chief Security Officer |
|
McLeod Health |
J. Wayne Byrd, Director of Security |
|
Memorial Healthcare |
Jeff Hauk, MSA, CPP, CHPA, PEM, Director, Public Safety & Police Authority Services |
|
Meta |
Nick Lovrien, Chief Global Security Officer |
|
Microsoft Corporation |
Brian K. Tuskan, Chief Security Officer, Senior Director of Security (Physical) |
|
Nationwide Mutual |
Jay Beighley, Associate Vice President |
|
News Corp |
Eduardo Jany, Chief Security Officer |
|
NRG |
Joe Walters, Senior Director, Enterprise Security & Real Estate |
|
OEIS Protection Inc. |
Ihab Mansour, CEO |
|
Oracle |
Michael Maloof, Vice President |
|
Orlando City Soccer Club / Exploria Stadium |
Robert Schnettler, Senior Director of Security & Guest Services |
|
Raytheon Technologies |
Tammi Morton, Vice President & Chief Security Officer |
|
San Gorgonio Memorial Hospital |
Joey E. Hunter Sr., Director of Security, Safety & Emergency Preparedness |
|
Scripps Health |
Anthony J. Roman, MA-HuB, CPP, CHPA, Corporate Director, Support Operations |
|
Seattle Children’s Hospital |
Jim Sawyer, Security Director |
|
Shanghai Tongtai Information Technology Co. Ltd. |
Xuehui Hu, CIO |
|
Sparrow Hospital |
Jerry Dumond, Director of Public Safety, Chief of Police Authority |
|
State Street Corporation |
Stephen D. Baker, CPP, Senior Vice President & Chief Security Officer |
|
Synopsys Inc. |
Jim Fussell, Senior Director, Global Safety & Security |
|
Takeda Pharmaceuticals Company Ltd |
Whit Chaiyabhat, Vice President, Head of Global Security & Crisis Management |
|
Texas Biomedical Research Institute |
Mark A. Hammargren, CPP, Director, Security & Emergency Preparedness |
|
Thrivent |
Mark Theisen, Director, Corporate Security & Business Resilience |
|
United Therapeutics Corporation |
Michael W. Wanik, Senior Director, Corporate Security |
|
University Health Network |
Todd Milne, Director, Security Operations, UHN CONNECT, Fire & Life Safety |
|
University of Alabama at Birmingham |
Anthony Purcell, Associate Vice President, Public Safety & Chief of Police |
|
University of Pennsylvania |
Kathleen Shields Anderson, J.D., MBA, Vice President for Public Safety |
|
VF Corporation |
Justin Cullinan, Vice President for Public Safety |
|
Victoria’s Secret & Co |
John Talamo, Senior Vice President - Asset Protection |
|
Wellstar Health System* |
Adrian Arriaga, Executive Director of Security |
|
Whirlpool Corporation |
Erik Antons, Chief Security Officer |
|
Wolfpack Protective Services Inc. |
Justin Joyce, CEO |
*at time of publication